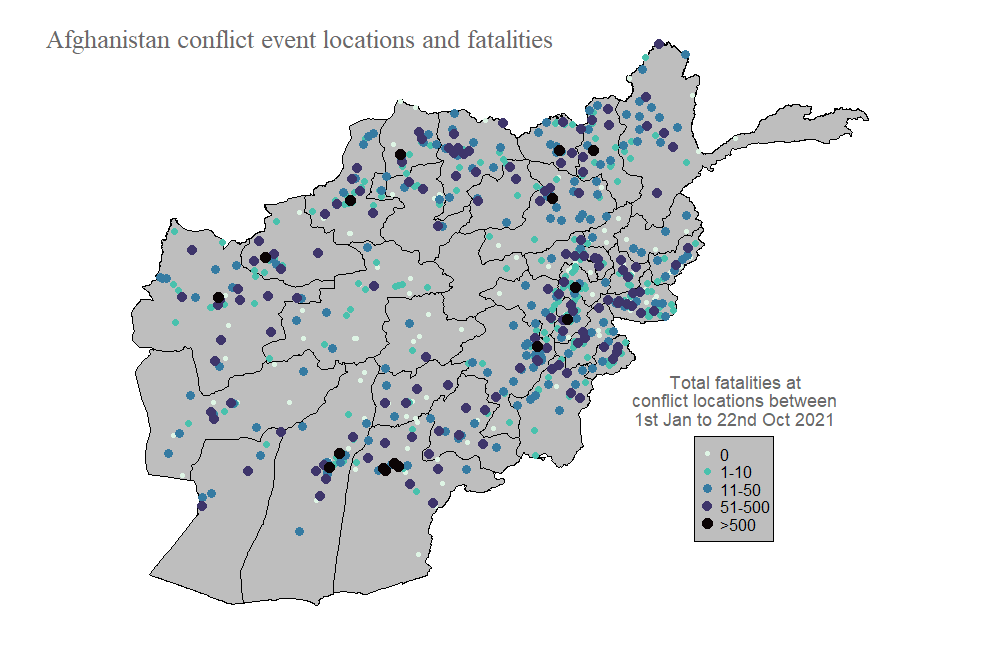
Map 1: Afghanistan conflict locations | 1st Nov 2021
Claire Dooley
#30DayMapChallenge theme: points
Data
- Armed Conflict Location and Event Data – ACLED (Raleigh et al., 2010; https://acleddata.com/)
- GADM administrative boundaries (Global Administrative Areas, 2020; https://gadm.org/data.html)
Code
Available here: https://github.com/cadooley/map_challenge_2021/blob/main/RScripts/map1_afg_conflict_events.R
I used the sf (Pebesma, 2018) and data.tables (Dowle et al., 2021) packages to convert data into an easy-to-use format, and the viridis package (Garnier et al., 2021) for the colorblind-friendly colour palette called ‘mako’.
About the map
Afghanistan has experienced decades of armed conflict (see this NPR article for a tiemline of events). The true number of conflict related fatalities is unknown, however, many organisations and researchers have produced estimates for different time periods and particular wars. Estimates of fatalities since 2001 (the beginning of the US-led invasion) mostly vary between approximately 150,000 and 200,000 deaths, depending on the source.
While estimating the number of deaths nationally is important for quantifing overall impacts of war, subnational estimates provide information about the severity of conflict in different regions and can be crucial for identifying the most vulnerable subpopulations.
The ACLED database provides a transparent collation of evidence of conflict events across the globe. The ACLED team have standardized the information extracted from news reports and other sources, which includes the type of event (e.g. battles, riots, explosions, etc.), actors involved, date and location. ACLED provide an impressive level of transparency about their approaches through videos and guides, including a comprehensive codebook explaining all the variables, values and categorizations in their datasets. One key feature of this database is the geo-referencing of events which allows affected populations to be pin-pointed. Because exact geo-locations are not always available, ACLED include precision scores for each event’s coordinates (1 = high precision, e.g. the settlement name or coordinates were reported; 2 = the part of the region was reported; 3 = only a large area or region name was reported). Similarly, precision scores are provided for dates of events too. This information means that practitioners and researchers can consider and evaluate uncertainties around which subpopulations may have been affected by conflict, informing response actions and delivery of services.
The map above illustrates a subset of ACLED’s data, showing the cumulative number of fatalities at each reported armed conflict location in Afghanistan between January and mid-October 2021. The ACLED data documents a total number of 41,689 fatalities across 9,077 conflict events at 712 locations, during this time period.
Afghanistan, like many other countries, faces a multitude of interacting factors that result in extended and complex humanitarian situations. Through 2021, political turmoil has exacerbated the impacts of drought, leaving a huge proportion of the country grappling with food insecurity. The New Humanitarian recently wrote an insightful piece on this.
Citations
- Raleigh, C., Linke, A., Hegre, H., Karlsen. J. (2010). “Introducing ACLED-Armed Conflict Location and Event Data.” Journal of Peace Research 47(5) 651- 660. Data downloaded on 30/10/2021 from https://acleddata.com/
- Global Administrative Areas (2020). “GADM database of Global Administrative Areas, version 3.6.” Data downloaded on 30/10/2021 from https://gadm.org/data.html
- Pebesma, E. (2018). “Simple Features for R: Standardized Support for Spatial Vector Data.” The R Journal, 10(1), 439–446. doi: 10.32614/RJ-2018-009
- Dowle, M., et al. (2021) “ data.table: Extension of ‘data.frame’ ” https://r-datatable.com, https://Rdatatable.gitlab.io/data.table, https://github.com/Rdatatable/data.table
- Garnier, S., Ross, N., Rudis, R., Camargo, P.A., Sciaini, M., Scherer, C. (2021). “viridis - Colorblind-Friendly Color Maps for R.” doi: 10.5281/zenodo.4679424, R package version 0.6.2, https://sjmgarnier.github.io/viridis/
License: CC BY
Back to main

