Map Challenge Intro | 31st Oct 2021
Claire Dooley
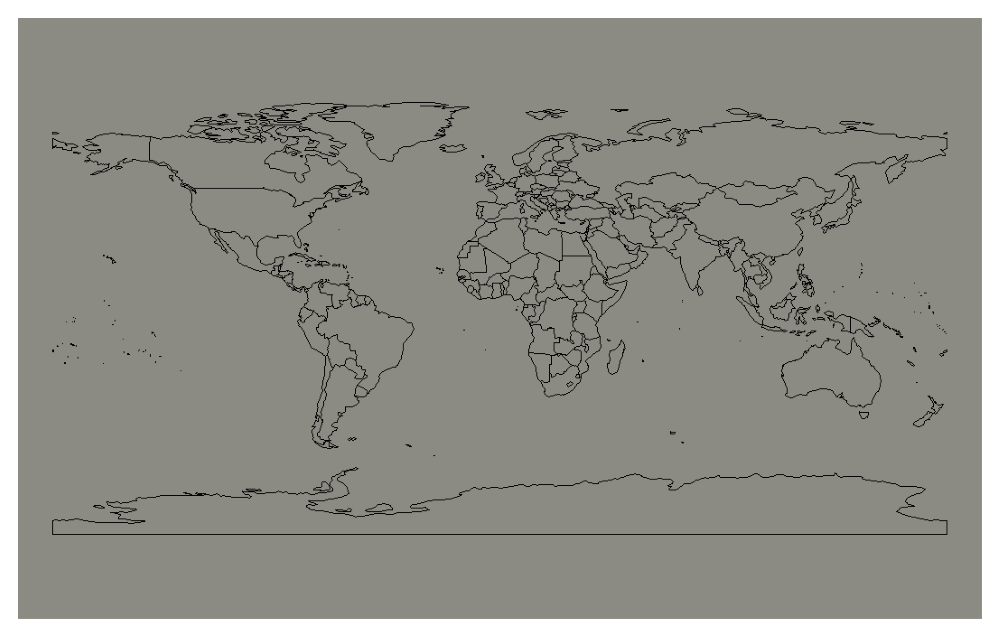
Throughout November, I will be making many maps as part of a fantastic initiative called #30DayMapChallenge started by Topi Tjukanov. I’m going to use this month to create maps that highlight spatial datasets that are essential for humanitarian response and research. Before diving in, I thought I’d begin with the above world map of national boundaries - the backdrop of all maps to come!
Armed conflict and natural disasters cause fatalities, diminshed health and forced displacement. They disrupt services and economies leading to elevated rates of disease, poverty and hunger. Faced with complex and fast-changing situations, timely and accurate data are vital for understanding the pathways of support and assistance that are most effective in providing short-term benefits and long-term prosperity for people affected by crises. Over the last few years, UNOCHA’s Centre for Humanitarian Data has made huge strides in collating datasets on a publicly available online platform called the Humanitarian Data Exchange (HDX). The platform aims to increase accessibility and usability of existing data as well as highlight gaps in available data and areas of duplicated efforts.
Over the next month, I’m going to map data that can be found on HDX or other public databases. Each map will be added on this site and will be accompanied by a short pieces about how they relate to current humanitarian crises and response efforts. I’ll give links to all the data I use as well as to relevant published news pieces and journal papers. I intend to use the free and open software R, and I’ll share code for all my maps in my map_challenge_2021 github repository.
If you’ve never used R before and you’re interested in learning, there are umpteen tutorials, videos and other resources online as well as a large online user community that is always on hand to help. You’ll find the answer to pretty much all R coding queries on the user forum Stack Overflow. R software can be downloaded from here.
The map image above was created using the ‘rworldmap’ R package (South, 2011).
Citations
South, Andy 2011 rworldmap: A New R package for Mapping Global Data. The R Journal Vol. 3/1 : 35-43. https://github.com/AndySouth/rworldmap/
License: CC BY
Back to main

